 Dark Ages Re-Creation Company


The mean compositions of the roasted and unroasted Virginia rock ore used for Iron II and Iron III (and I assume Iron IV) are shown in the Table 2, together with the two iron rich CANMET certified reference materials (FER-1 and FER-3) that were analysed at the same time as quality control standards. No separate determination was made of total carbon (as either organic matter or carbonate) or ferrous (reduced) iron content. Any carbon present in the ore is included along with absorbed and structurally bound water in the total loss on ignition (LOI) and only the total iron content of the ore, expressed as Fe2O3T, is given. Because the rock ore is not expected to contain high concentrations carbon, the absence of separate carbon determination is not seen as a problem. Uncertainties reflect the variation about the mean of three separate determinations for each pulverised rock. The bulk chemical compositions are consistent with an original composition comprised primarily of 5 – 15 wt% quartz and ~ 80 - 95 wt% iron oxy-hydroxide (goethite), with traces of other minerals.
It is clear that roasting of the ore successfully drove off the majority of the volatile components from the ore (reflected in the decreased loss on ignition, LOI). However, it is unclear why the roasted ore is significantly enriched in silica and depleted in iron relative to the raw material; roasting should have reduced the LOI and proportionally increased all other components. Although efforts were made to select representative pieces of each ore type, the material was highly heterogeneous and it is possible that the chosen piece of roasted ore was uncharacteristically silica-rich.
| Virginia Rock Ore | Roasted Ore | FER-1 | FER-3 | |||||||
| Measured | Ref. | Measured | Ref. | |||||||
| SiO2 | 3.90 | ± 0.35 | 13.75 | ± 0.22 | 16.94 | ± 0.26 | 16.95 | 54.36 | ± 1.05 | 53.61 |
| TiO2 | 0.040 | ± 0.007 | 0.129 | ± 0.005 | 0.027 | ± 0.001 | 0.030 | 0.009 | ± 0.003 | 0.010 |
| Al2O3 | 1.09 | ± 0.41 | 4.14 | ± 0.06 | 0.61 | ± 0.01 | 0.52 | 0.16 | ± 0.03 | 0.09 |
| Fe2O3T | 82.69 | ± 0.02 | 79.31 | ± 0.11 | 77.55 | ± 0.13 | 75.83 | 45.64 | ± 0.06 | 44.55 |
| MnO | 0.15 | ± 0.00 | 0.13 | ± 0.00 | 0.242 | ± 0.001 | 0.220 | 0.090 | ± 0.001 | 0.080 |
| MgO | 0.09 | ± 0.16 | 0.16 | ± 0.01 | 0.25 | ± 0.01 | 0.30 | 1.03 | ± 0.01 | 1.02 |
| CaO | 0.26 | ± 0.08 | 0.22 | ± 0.00 | 3.37 | ± 0.01 | 3.29 | 0.87 | ± 0.01 | 0.84 |
| Na2O | 0.07 | ± 0.09 | 0.007 | ± 0.025 | 0.11 | ± 0.03 | 0.03 | -0.03 | ± 0.02 | 0.03 |
| K2O | 0.06 | ± 0.01 | 0.49 | ± 0.00 | 0.013 | ± 0.003 | 0.020 | 0.021 | ± 0.001 | 0.030 |
| P2O5 | 3.13 | ± 0.01 | 2.37 | ± 0.01 | 2.34 | ± 0.01 | 2.39 | 0.07 | ± 0.00 | 0.07 |
| BaO | -0.005 | ± 0.011 | 0.010 | ± 0.006 | 0.14 | ± 0.01 | 0.11 | 0.000 | ± 0.007 | 0.001 |
| Cr2O3 | 0.002 | ± 0.001 | 0.002 | ± 0.001 | -0.001 | ± 0.002 | 0.001 | 0.014 | ± 0.022 | 0.001 |
| H2O+CO2 | 12.56 | ± 0.00 | 2.56 | ± 0.00 | -0.86 | ± 0.00 | -0.16 | ± 0.00 | ||
| TOTAL | 91.48 | ± 1.05 | 100.71 | ± 0.19 | 101.58 | ± 0.39 | 102.23 | ± 1.09 | ||
The slags produced during the first three tappings were imaged and analysed for major and minor elements using an electron microprobe at the Geosciences Laboratories of the Ontario Geological Survey. Images are back-scattered electron images, in which components with different mean atomic masses show up as different shades of grey. The higher the average atomic mass (in this case the higher the Fe content), the brighter the phase appears in the image. Because the EMP is unable to determine the oxidation state of analytes, all Fe data are expressed as total Fe as ferrous (reduced) iron.
Whereas the earliest slags contained abundant silicate (mostly fayalitic olivine), oxide, and metal phases, as well as quenched glass, later slags were predominantly quenched glass with minor amounts of oxide, metal and/or refractory material. The decrease in olivine and increase in the amount of glass in the slags through the run is may reflect an increase in smelter temperature with time (so that the slag is more rapidly cooled through the olivine liquidus during tapping) or a change in slag composition so that olivine is no longer formed on cooling.
Despite the addition of molten material from the furnace walls, the composition of the slag at the end of the run is very similar to that at the beginning (33 – 36% SiO2, 27 – 36% FeO, 11 – 15% Al2O3, 1.5 – 2.0% K2O), suggesting that any mixing of the two silicate liquids was relatively local.
From the chemical analyses of the slags, there is no definitive evidence that they were significantly depleted in Fe at any stage owing to the production of Fe metal. From the presence of Fe blebs in the slags, it is clear that metal was formed and present from an early stage in the process. The absence of strong Fe depletion in the slag may indicate that either a steady state was reached, with Fe being added as ore as fast as it was being removed as metal, or that only minor amounts of Fe were produced.
Slag Tap 1 was carried out 1 hour 28 minutes into the run. Three different pieces of slag were taken for analysis. The slag flowed very poorly (see smelt report) and was inferred to represent the liquid parts of the bowl, rather than the liquid slag that forms above of the bowl. When viewed under the electron microscope, the reason for the high viscosity is clear; each of the three pieces of slag contain abundant silicate and oxide crystals that probably formed as soon as the slag left the furnace.
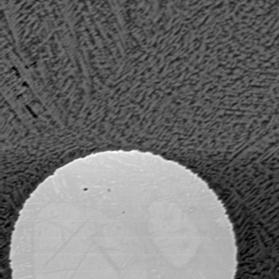
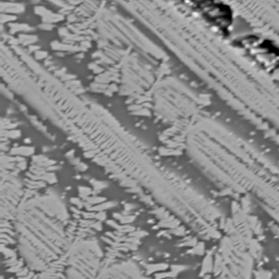
Figure 1 Electron back-scattered images of: slag tap 1, Piece A. Left image at magnification 200. Right image a portion of the same area at magnification 2000 to show skeletal crystals.
Slag composed skeletal fayalitic olivine crystals (pale grey needles) in glassy matrix (dark background) with blebs of an anomalously Ni-rich early metal phase (bright circle in left image). The origin of this Ni-rich phase is unclear. The high Ca, Al, and K content of the glass (higher than the original ore) indicate that some melting of the furnace walls must have already taken place in order to create the slag.
Metals
| Si | Ti | Cr | Al | Fe | Mn | Mg | Ni | Ca | Na | K | P | Sum | ||
| Metal | 0.09 | 0.03 | 0 | 0.04 | 89.7 | 0.3 | 0.29 | 4.42 | 0 | 0.33 | 0 | 0 | 95.21 | Melted air intake |
| Metal | 0.07 | 0 | 0 | 0 | 92.98 | 0.45 | 0 | 4.34 | 0.05 | 0 | 0.02 | 0 | 97.91 | Melted air intake |
| Metal | 0.06 | 0 | 0 | 0.06 | 85.52 | 0.57 | 0 | 2.74 | 0.03 | 0.1 | 0 | 0 | 89.07 | Melted air intake mixed with new iron (?) |
| Metal | 0.09 | 0 | 0 | 0 | 91.68 | 0.48 | 0.12 | 4.6 | 0.08 | 0 | 0.02 | 0.08 | 97.16 | Melted air intake |
Silicates/Oxides
| SiO2 | TiO2 | Cr2O3 | Al2O3 | FeO | MnO | MgO | NiO | CaO | Na2O | K2O | P2O5 | Sum | Interpretation | |
| Average Glass/Oxide? | 28.49 | 0.39 | 0.05 | 8.3 | 52.35 | 0.77 | 0.62 | 0.24 | 7.35 | 0.17 | 0.74 | 2.07 | 101.5 | "Average slag" |
| Fayalite* Fa0.89Fo0.02Mo0.05 |
28.13 | 0.07 | 0 | 1.87 | 63.3 | 0.81 | 0.86 | 0 | 2.74 | 0.33 | 0.15 | 1.15 | 99.41 | Skeletal grains (starting to crystallise) |
| Glass | 33.69 | 0.41 | 0 | 15.02 | 29.89 | 0.07 | 0.26 | 0.08 | 15.2 | 0.06 | 1.63 | 3.26 | 99.56 | Initially Fe-rich glass |
Olivine compositions expressed as proportions of end members in solid solution (Fa: fayalite, Fe2SiO4; Fo, forsterite, Mg2SiO4; Mo, monticellite, Ca2SiO4).
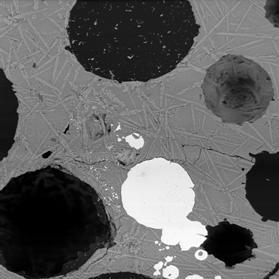
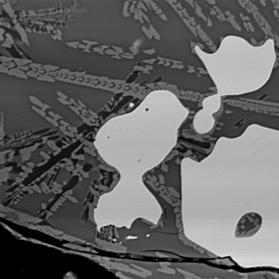
Figure 2 Electron back-scattered images of: slag tap 1, Piece B. Left image at magnification 100. Right image a portion of the same area at magnification 1000 to show skeletal crystals.
Similar to piece A, but more rapidly quenched leading to less crystal growth. The composition of the glass is very similar to that of piece A, but the Ni enrichment of the metal is absent, suggesting that this may be freshly smelted metal.
Metals
| Si | Ti | Cr | Al | Fe | Mn | Mg | Ni | Ca | Na | K | P | Sum | Interpretation | |
| Metal | 0.01 | 0 | 0 | 0.06 | 96.29 | 0.52 | 0.25 | 0.3 | 0.04 | 0.57 | 0.01 | 0.69 | 98.73 | Smelted metal |
| Metal | 0.21 | 0 | 0 | 0 | 97.79 | 0.59 | 0 | 0 | 0.01 | 0.32 | 0.02 | 0 | 98.94 | Smelted metal |
Silicates/Oxides
| SiO2 | TiO2 | Cr2O3 | Al2O3 | FeO | MnO | MgO | NiO | CaO | Na2O | K2O | P2O5 | Sum | Interpretation | |
| Glass | 35.4 | 0.76 | 0 | 13.68 | 27.24 | 0.48 | 0.66 | 0.08 | 15.64 | 0.04 | 2.02 | 1.38 | 97.39 | Little change in glass composition |
| Glass | 35.02 | 0.66 | 0 | 11.6 | 31.29 | 0.61 | 1.2 | 0 | 14.53 | 0.2 | 1.83 | 1.2 | 98.14 | Little change in glass composition |
| Glass | 32.63 | 0.45 | 0.09 | 12.08 | 35.36 | 0.42 | 1.46 | 0 | 10.21 | 0.3 | 1.72 | 2.89 | 97.59 | Possibly older/earlier liquid with less input from furnace walls |
| Fayalite Fa0.80Fo0.16Mo0.03 |
30.56 | 0.05 | 0 | 0.35 | 58.78 | 1 | 6.6 | 0 | 1.93 | 0 | 0.1 | 0.14 | 99.51 | Skeletal grains (starting to crystallise) |
| Fayalite Fa0.79Fo0.18Mo0.03 |
29.97 | 0.02 | 0 | 0.45 | 57.66 | 0.85 | 7.52 | 0.07 | 1.78 | 0.01 | 0.12 | 0.05 | 98.5 | Skeletal grains (starting to crystallise) |
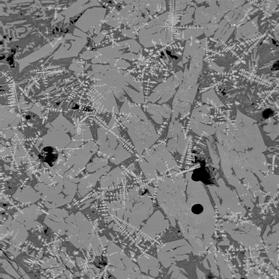
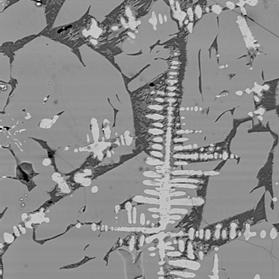
Figure 3 Electron back-scattered images of: slag tap 1, Piece C. Left image at magnification 100. Right image a portion of the same area at magnification 500 to show intergrowth of sub-equant olivine crystals and iron oxide dendrites.
“Mushy” slag composed of coarse-grained remobilised fayalitic olivine (medium grey), quenched glass (dark grey), crystallising fayalitic olivine (fine-grained medium grey material in glass), and dendritic iron oxide (pale grey needle-like crystals). Circular features are bubble of gas trapped in the slag when cooled. The abundance and size of the olivine crystals indicate that the melt cooled slowly after tapping. The interpenetration of the oxide crystals indicate that they formed prior to or at the same time as the olivine. The compositions of the oxide phases are between those expected for magnetite (FeOT ~ 93%) and wüstite (FeOT = 100 – 102.3%), consistent with the local presence of only mildly reducing conditions.
Silicates/Oxides
| SiO2 | TiO2 | Cr2O3 | Al2O3 | FeO | MnO | MgO | NiO | CaO | Na2O | K2O | P2O5 | Sum | Interpretation | |
| Glass | 34.12 | 0.32 | 0 | 14.22 | 20.06 | 0.25 | 0 | 0 | 22.14 | 0.21 | 1.92 | 4.95 | 98.19 | Low Fe, high Ca: |
| Fayalite (Fa0.90Fo0.06Mo0.05) |
28.81 | 0 | 0 | 0.35 | 67.15 | 0.86 | 1.14 | 0.24 | 1.3 | 0.39 | 0.01 | 0 | 100.25 | Recrystallised slag (coarse grained) |
| Fayalite (Fa0.90Fo0.06Mo0.05) |
28.75 | 0 | 0 | 2.17 | 56.54 | 0.66 | 0.11 | 0 | 8.29 | 0.48 | 0.33 | 2.65 | 99.99 | Recrystallised slag (coarse grained) |
| Fayalite (Fa0.94Fo0.04Mo0.02) | 28.94 | 0 | 0.02 | 0.32 | 65.96 | 0.84 | 1.76 | 0 | 1.04 | 0.13 | 0 | 0.04 | 99.05 | Recrystallised slag (coarse grained) |
| Oxide (FeO-rich Magnetite, Fe3O4) |
0.8 | 0.46 | 0.03 | 0.77 | 95.85 | 0.57 | 0.19 | 0.25 | 0.28 | 0.47 | 0.08 | 0.02 | 99.74 | Oxidised conditions (Fe2O3 and FeO present) |
| Oxide (FeO-rich Magnetite, Fe3O4) |
0.39 | 0.52 | 0.01 | 0.3 | 94.82 | 0.48 | 0 | 0 | 0.3 | 0.23 | 0.01 | 0 | 97.06 | Oxidised conditions (Fe2O3 and FeO present) |
Slag Tap 2 was carried out 2 hours into the run. Only one piece of slag was taken for analysis. This time the slag was a lot more fluid, as reflected by the lower crystal content.
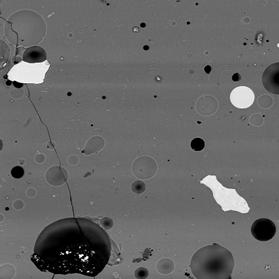
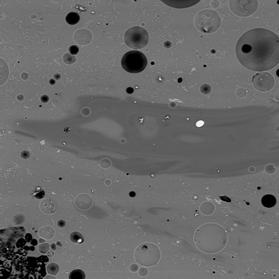
Figure 4 Electron back-scattered images of: slag tap 2, Piece A. Both images at magnification 200.
Slag is free of crystalline phases (e.g., olivine and/or oxides), but contains abundant bubbles as well as blebs of metal. The cuspate shape of the blebs may indicate that the metal was fluid when the slag was tapped. The compositions of the metal blebs appear to be highly heterogeneous, with large contrasts in P content (0.3 – 0.4% vs. 2.4 – 2.9 %). Within the glass are wispy regions of a darker colour, indicating that they have a different composition (less Fe, more Ca, Al, and K), that may be more heavily influenced by melting of the furnace walls, as well as Mg- and Al-rich Fe-oxide grains (magnesio-ferrite and hercynite). The implication of these oxides for processes within the smelter is unclear at this time.
Metals
| Si | Ti | Cr | Al | Fe | Mn | Mg | Ni | Ca | Na | K | P | Sum | Interpretation | |
| Left Image | ||||||||||||||
| Metal | 0.16 | 0 | 0 | 0 | 90.99 | 0.49 | 0.15 | 0.09 | 0.07 | 0.38 | 0 | 2.39 | 94.71 | High P round bleb |
| Metal | 0.08 | 0 | 0 | 0.01 | 89.61 | 0.49 | 0.04 | 0.08 | 0.02 | 0.35 | 0 | 2.89 | 93.59 | High P round bleb |
| Metal | 0.13 | 0 | 0 | 0.01 | 95.98 | 0.55 | 0.08 | 0.05 | 0.03 | 0.31 | 0.05 | 0.31 | 97.49 | Smelted metal |
| Metal | 0 | 0 | 0 | 0.03 | 95.69 | 0.62 | 0 | 0.08 | 0.01 | 0.14 | 0 | 0.48 | 97.06 | Smelted metal |
| Right image | ||||||||||||||
| Metal in dark glass | 0.14 | 0 | 0 | 0.04 | 95.75 | 0.57 | 0 | 0.03 | 0.23 | 0.04 | 0.04 | 0.9 | 97.73 | Smelted metal |
Silicates/Oxides
| SiO2 | TiO2 | Cr2O3 | Al2O3 | FeO | MnO | MgO | NiO | CaO | Na2O | K2O | P2O5 | Sum | Interpretation | |
| Medium glass | 44.51 | 0.48 | 0.06 | 10.14 | 21.26 | 0.7 | 2.36 | 0.04 | 13.33 | 0.58 | 3.43 | 1.04 | 97.95 | Mixture of pale and dark glass |
| Pale glass | 36.21 | 0.55 | 0 | 11.64 | 30.72 | 0.89 | 2.12 | 0.03 | 12.75 | 0.17 | 1.71 | 1.22 | 97.99 | High Fe, low K: molten ore |
| Dark glass | 51.33 | 0.52 | 0.04 | 9.8 | 12.57 | 0.99 | 2.44 | 0 | 15.71 | 0.26 | 4.2 | 0.01 | 97.87 | High K, low Fe: melt from clay walls |
| Glass near metal bleb | 40.64 | 0.43 | 0 | 11.43 | 25.22 | 0.68 | 2.26 | 0 | 12.58 | 0.13 | 2.61 | 1.64 | 97.62 | High Fe, low K: molten ore |
| Hercynite (Mg0.2Fe0.8Al1.6Fe0.4O4) |
0.37 | 0.95 | 0.57 | 46.67 | 44.97 | 0.46 | 4.34 | 0.02 | 0.6 | 0 | 0 | 0.21 | 99.16 | ? |
| Magnesioferrite (Mg0.4Fe0.6Fe2O4) |
0.47 | 0.13 | 0 | 1.12 | 88.26 | 0.59 | 7.44 | 0 | 0.46 | 0 | 0 | 0.03 | 98.51 | ? |
Slag Tap 3 was carried out 2 hours 58 minutes into the run. Only one piece of slag was taken for analysis. This slag tap was carried out about 30 minutes after problems arose with burn-through of the furnace all above the tuyure.
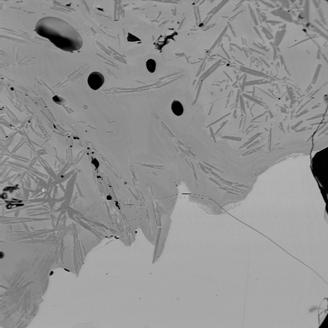
Figure 5 Electron back-scattered images of: slag tap 3, Piece A. Magnification 100
The image shows the interface between two molten silicate phases. In the lower part of the image is a (pale) Fe-rich glass that hosts abundant metallic blebs (not see in this image). In the upper part of the image is a darker, more K-, Mg-, Si-, and Ca-rich glass that contains acicular anorthite (Ca-Al silicate). The Fe-poor glass also appears to contain compositional different zones. The large volume of a separate Fe-poor glass towards the end of the run is consistent with the ongoing melting and burn through of the furnace wall.
Metals
| Si | Ti | Cr | Al | Fe | Mn | Mg | Ni | Ca | Na | K | P | Sum | Interpretation | ||||||||||
| Metal | 0.06 | 0 | 0 | 0.31 | 97.4 | 0.59 | 0.03 | 0.36 | 0 | 0.7 | 0.06 | 0.72 | 100.23 | Smelted iron | |||||||||
| Metal | 0.05 | 0 | 0 | 0.37 | 96.8 | 0.6 | 0.03 | 0.35 | 0 | 0.38 | 0 | 0.54 | 99.13 | Smelted iron | |||||||||
| Metal | 0.2 | 0 | 0.04 | 0.41 | 96.59 | 0.59 | 0.31 | 0.43 | 0 | 0.51 | 0.03 | 0.71 | 99.82 | Smelted iron | |||||||||
Silicates/Oxides
| SiO2 | TiO2 | Cr2O3 | Al2O3 | FeO | MnO | MgO | NiO | CaO | Na2O | K2O | P2O5 | Sum | Interpretation | |
| Pale Fe-rich glass | 35.16 | 0.66 | 0 | 13.38 | 28.11 | 0.57 | 2.16 | 0.06 | 14.49 | 0.13 | 1.73 | 1.04 | 97.49 | High Fe, low K: molten ore |
| Dark Fe-poor glass | 43.48 | 0.87 | 0.01 | 16.73 | 10.81 | 0.33 | 3.61 | 0.01 | 18.11 | 0 | 3.03 | 0.07 | 97.04 | High K, low Fe: melt from clay walls |
| Dark Fe-poor Glass | 40.36 | 0.98 | 0.06 | 13.28 | 15.99 | 0.63 | 3.76 | 0.13 | 18.22 | 0.27 | 3.35 | 0.28 | 97.3 | Low Fe, high K, Mg containing anorthite shards: molten refractory |
| Anorthite (CaAl2Si2O8) | 42.75 | 0.14 | 0 | 35.51 | 0.52 | 0 | 0.39 | 0.09 | 19.26 | 0.25 | 0.27 | 0 | 99.18 | Acicular refractory grains (recrystallised?) |
 |
Reports of all of our iron smelting efforts along with more articles and information are available on the "Iron Smelting in the Viking Age" CD from the Wareham Forge. Copies of the CD can be purchased here. |